H3C Technologies H3C Intelligent Management Center User Manual
Page 677
663
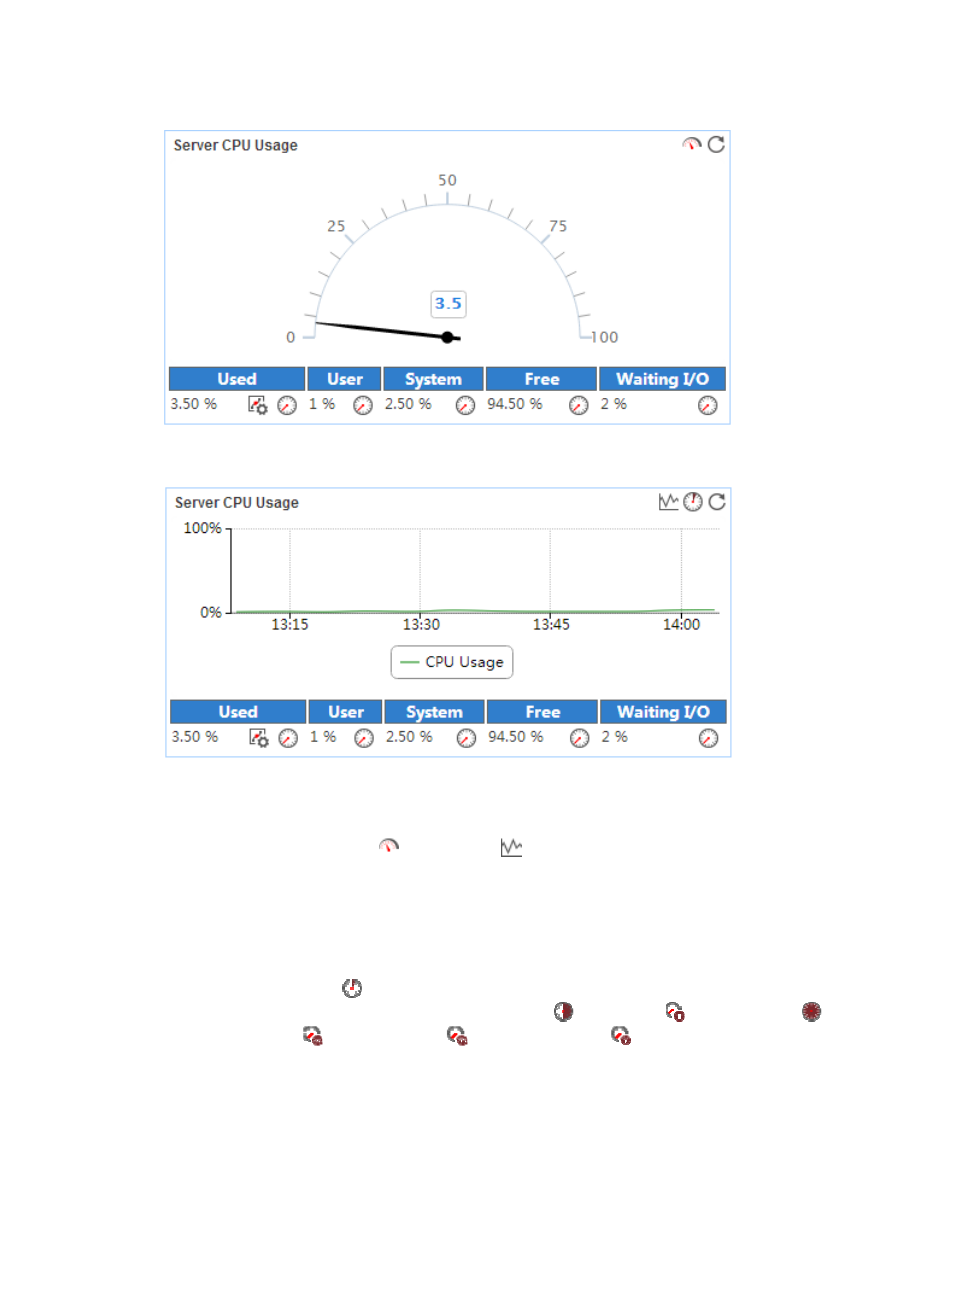
Figure 576 Server CPU Usage—Dashboard area layout
Figure 577 Server CPU Usage—Trend graph area layout
Server CPU Usage area fields:
•
Server CPU Usage dashboard or trend graph—View the area in a dashboard or a trend graph.
Click the Dashboard icon
or Trend icon
on the top right corner to switch between the
graphs.
{
Dashboard graph—Shows the CPU usage of the KVM server in the last polling period.
{
Trend graph—Shows the CPU usage trend of the KVM server over a specific time range in a line
graph. By default, the graph shows the last hour data. Point to a spot on the curve to view the
CPU usage of the KVM server at the specific time point. To change the report period, click the
Last 1 Hour icon
on the upper right of the graph, and then select an icon from the list.
Available options include the Last 6 Hours icon
, Today icon
, Yesterday icon
, This
Week icon
, This Month icon
, and This Year icon
.
•
Used—CPU usage of the KVM server in the last polling period.
•
User—Percentage of CPU resources used by the KVM server to process user requests in the last
polling period.
•
System—Percentage of CPU resources used by the KVM management system in the last polling
period.