Connection time – H3C Technologies H3C Intelligent Management Center User Manual
Page 276
262
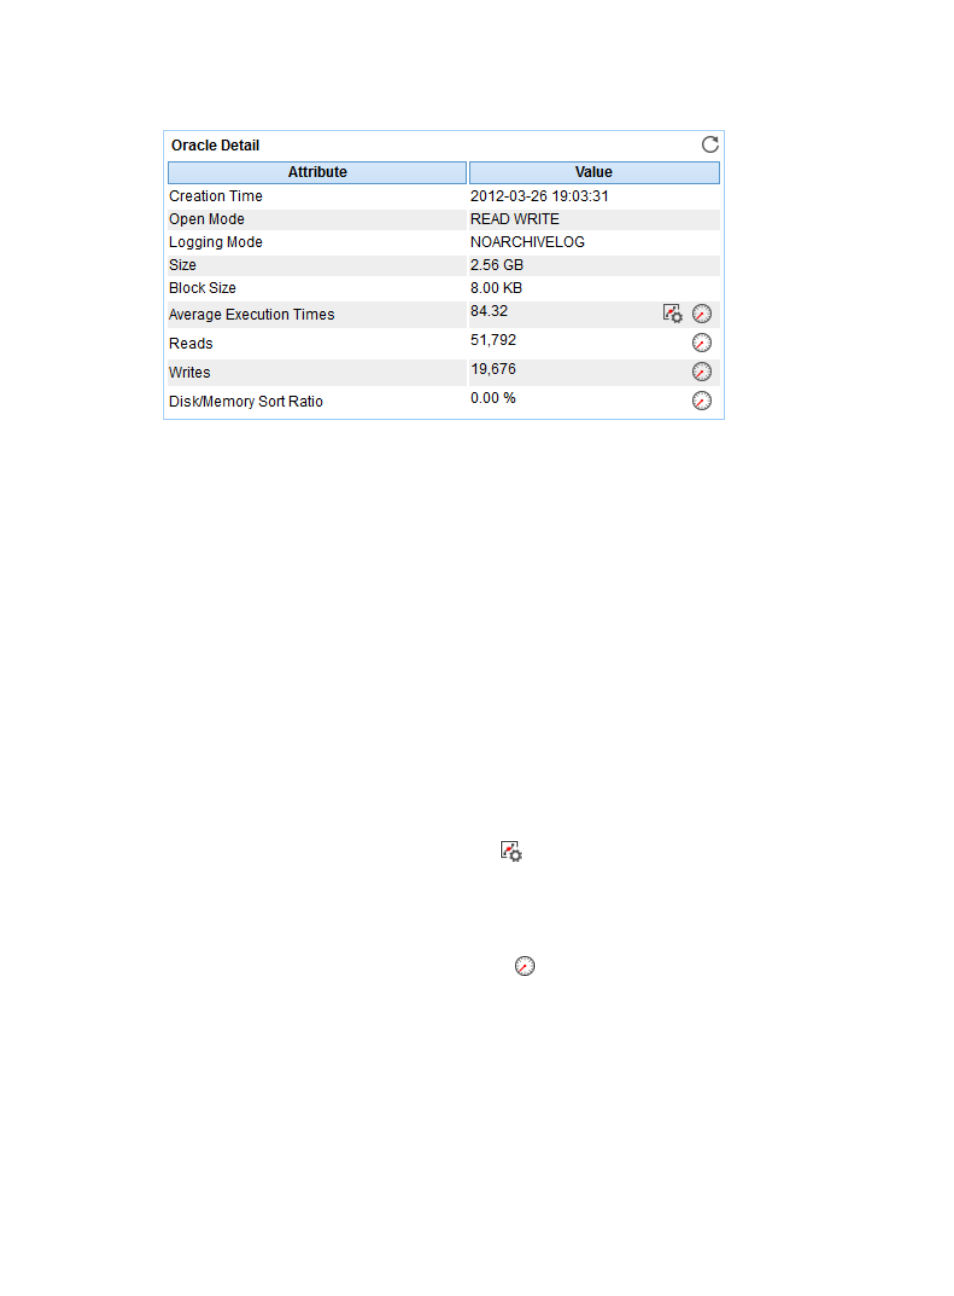
Figure 211 Oracle Details area layout
Oracle Details area field:
•
Creation Time—Time when Oracle installation was completed.
•
Open Mode—Current open mode for Oracle. Open Modes include READ ONLY and READ WRITE.
•
Logging Mode—Current logging mode for Oracle. The logging modes include the following types:
{
ARCHIVELOG—Old log files are automatically copied to the specified path and cannot
overwritten by new log files during the log file switch.
{
NOARCHIVELOG—Old log files are overwritten by new log files during the log file switch.
•
Size—Size of disk space used by all the datafiles in Oracle when APM last polled Oracle.
•
Block Size—Default standard block size in Oracle.
•
Average Execution Times—Average times of executing all the SQL statements in Oracle when APM
last polled Oracle.
•
Reads—Times of Oracle reading data blocks from the disk when APM last polled Oracle.
•
Writes—Times of Oracle writing data blocks to the disk when APM last polled Oracle.
•
Disk/Memory Sort Ratio—Disk/memory sorting rate in the most recent polling interval. It is
obtained by using the formula: Disk sorting attempts/Memory sorting attempts x 100%.
•
Set Threshold—Click the Set Threshold icon
to set alarm thresholds for the average execution
times. The data is highlighted in orange when the average execution time reaches the level-1
threshold, and is highlighted in red when the average execution time reaches the level-2 threshold.
Use the global thresholds or custom thresholds. For information about setting the thresholds, see "
•
History Record—Click the History Record icon
to view the history graph of the database details
trend. Point to a spot on the curve to view the database details at the specific time point. Authorized
users can view the database details over the last 1 hour, last 6 hours, today, yesterday, this week,
this month, and this year by clicking the corresponding icons on the upper right of the graph.
Connection Time
The Connection Time area layout is shown in