Application traffic, Websphere server, Adding a websphere server application monitor – H3C Technologies H3C Intelligent Management Center User Manual
Page 384
370
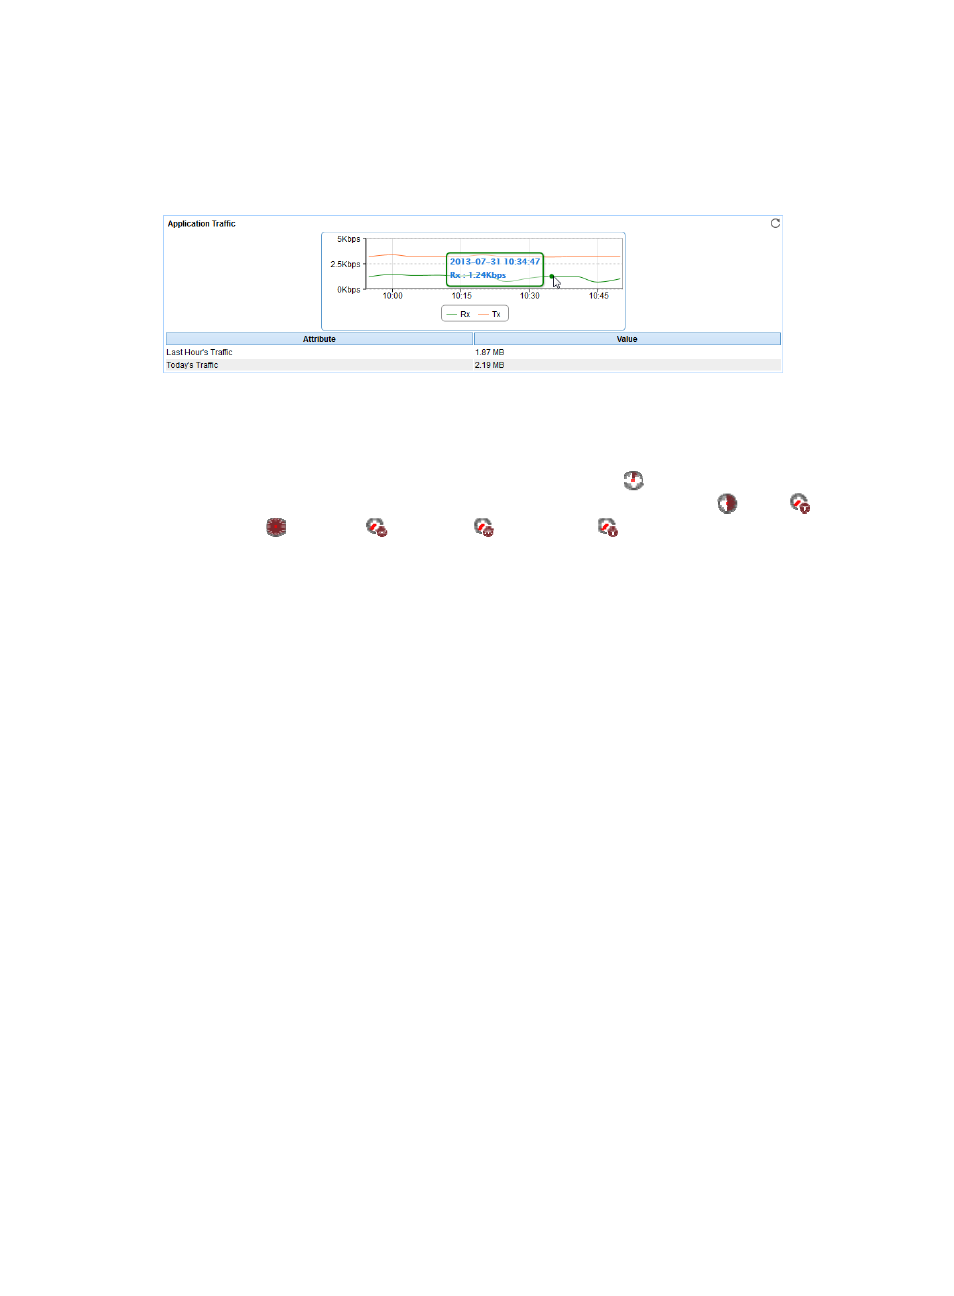
Application Traffic
The Application Traffic area layout is shown in
. APM collects the traffic statistics of the
GlassFish server based on the IP address and port number of the GlassFish server host.
Figure 311 Application Traffic area layout
Application Traffic area fields:
•
Application Traffic trend graph—Shows changes of inbound (Rx) and outbound (Tx) traffic over the
last 1 hour. The green curve shows the inbound traffic and the orange curve shows the outbound
traffic. To change the report period, click the Last 1 Hour icon
on the upper right of the graph,
and then select an icon from the list. Available options include Last 6 Hours
, Today
,
Yesterday
, This Week
, This Month
, and This Year
. Point to a spot on the curve to view
the application traffic at the specific time point. Click Rx or Tx to display or hide the corresponding
monitor index in the graph.
•
Attribute/Value—Monitor index name and data that was obtained when APM last polled the
GlassFish server.
{
Last Hour's Traffic—Total traffic sent and received by the GlassFish server over the last 1 hour.
{
Today's Traffic—Total traffic sent and received by the GlassFish server since 00:00 today.
WebSphere server
IBM WebSphere Application Server (WebSphere Server for short) is the basis of the IBM basic
infrastructure for running Web applications. APM provides the ability to monitor WebSphere servers of
versions 6.1 and 7.0.
Adding a WebSphere server application monitor
APM monitors the WebSphere servers through the SOAP service provided by the server. When you add
application monitors for WebSphere servers, follow these guidelines:
•
Add WebSphere hosts to the IMC platform so APM can obtain and display network connections of
the hosts and their access devices in the application topology. For more information about adding
hosts to the IMC platform, see H3C IMC Base Platform Administrator Guide.
•
Obtain the username and password used for accessing the SOAP service if SOAP authentication is
enabled for the WebSphere server.
•
To view traffic statistics in the monitor report of the WebSphere server application, make sure at
least one probe is configured in APM. After a WebSphere server application monitor is added,
APM sends the IP address and service port of the monitored WebSphere server application to the
probes for traffic collection.
To add a WebSphere server application monitor: