Response time, N in, Figure 454 – H3C Technologies H3C Intelligent Management Center User Manual
Page 563
549
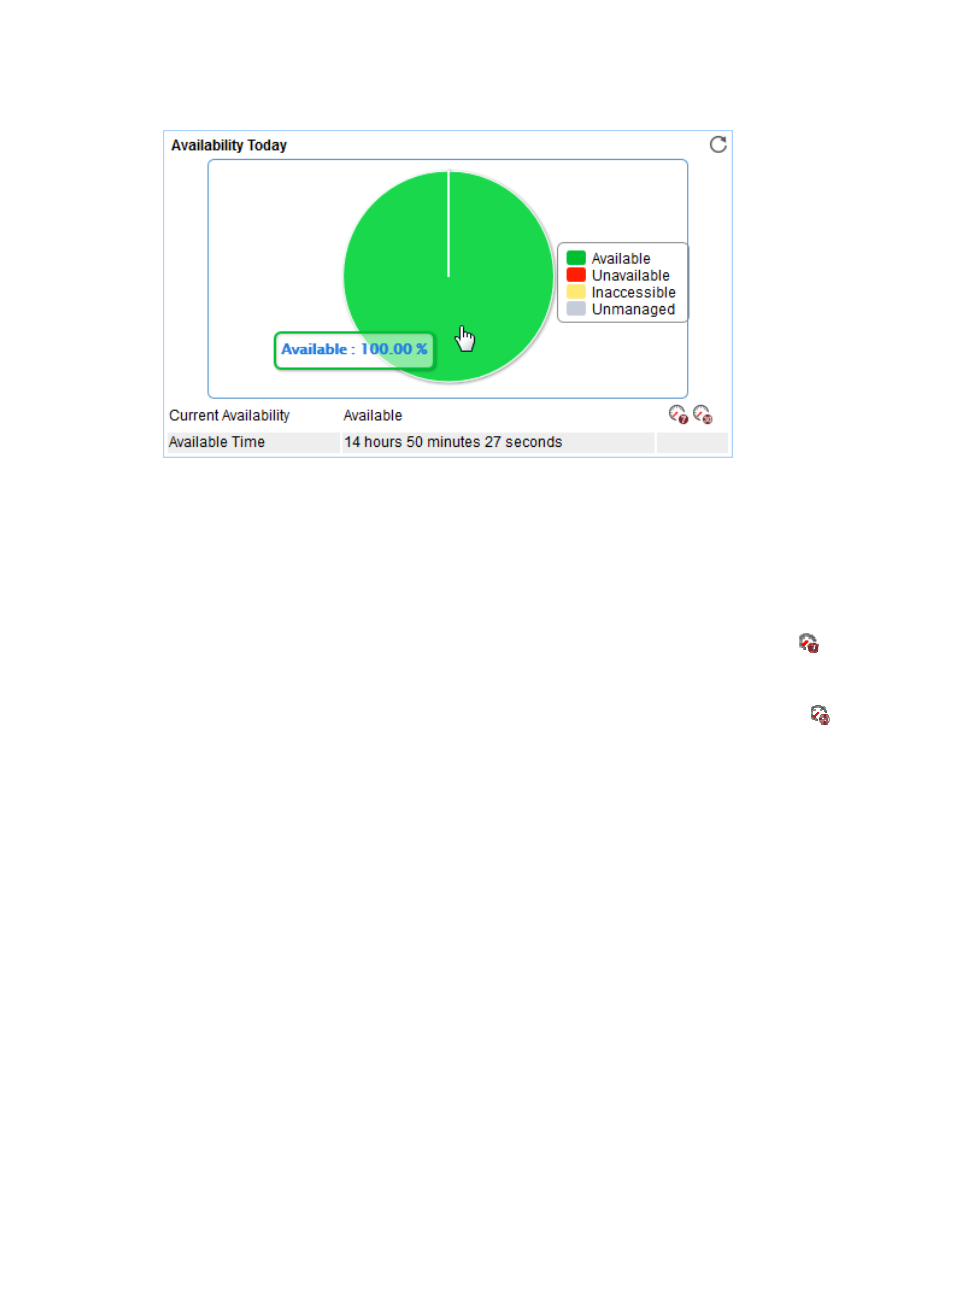
Figure 454 Availability Today area layout
Availability Today area fields:
•
Availability pie chart—Shows time duration percentages of the availability states
for TCP Port today.
The availability states include Available, Unavailable, Inaccessible, and Unmanaged. To view the
time duration percentage of a specific availability state, point to the corresponding slice in the
chart.
•
Current Availability—Availability of TCP Port in the last polling period.
{
To view the availability of TCP Port in the last 7 days, click the Weekly History icon
. The
weekly availability data is collected hourly. To view the time duration percentages of
availability states at a specific time, point to that time.
{
To view the availability of TCP Port in the last 30 days, click the Monthly History icon
. The
monthly availability data is collected daily. To view the time duration percentages of availability
states on a specific day, point to that day.
•
Available Time—Total available time duration of TCP Port since 00:00 today.
•
Unavailable Time—Total unavailable time duration of TCP Port since 00:00 today.
•
Inaccessible Time—Total inaccessible time duration of TCP Port since 00:00 today.
•
Unmanaged Time—Total unmanaged time duration of TCP Port since 00:00 today.
Availability time statistics of a new application monitor are collected since the application monitor was
added. An availability time field does not appear when its value is 0.
Response Time
APM sends a connection request to the TCP port of an application and records the time that the
application responds to the request each time APM polls TCP Port.