Net abnormality, N in, Figure 259 – H3C Technologies H3C Intelligent Management Center User Manual
Page 326
312
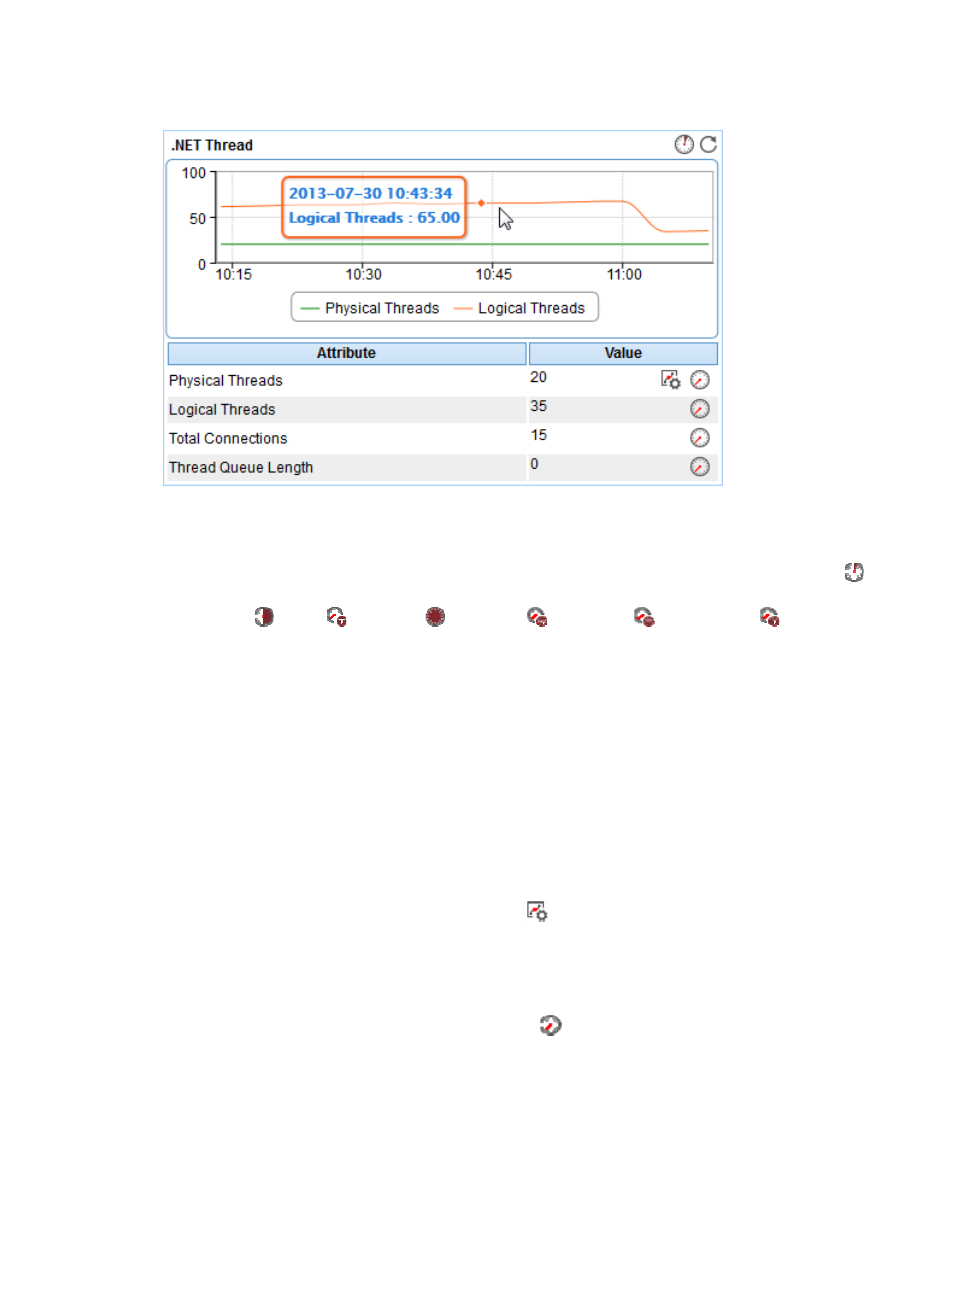
Figure 259 .NET Thread area layout
.NET Thread area fields:
•
.NET threads trend graph—Shows changes of the numbers of physical threads and logical threads
of the .NET server over the last 1 hour. To change the report period, click the Last 1 Hour icon
on the upper right of the graph, and then select an icon from the list. Available options include Last
6 Hours
, Today
, Yesterday
, This Week
, This Month
, and This Year
. Point to a
spot on the curve to view the application traffic at the specific time point. Click Physical Threads or
Logical Threads to display or hide the corresponding monitor index in the graph.
•
Attribute/Value—Monitor index name and data.
{
Physical Threads—Number of native OS threads created and managed by the .NET server to
act as underlying threads for .NET thread objects in the last polling interval.
{
Logical Threads—Number of current .NET thread objects created and managed by the .NET
server in the last polling interval.
{
Total Connections—Total number of times the threads in the runtime have failed to acquire a
managed lock in the last polling interval.
{
Thread Queue Length—Total number of threads in all the .NET applications waiting to acquire
a managed lock in the last polling interval.
{
Set Threshold—Click the Set Threshold icon
to set alarm thresholds for the number of
physical threads. The data is highlighted in orange when it reaches the level-1 threshold, and is
highlighted in red when it reaches the level-2 threshold. Use either the global thresholds or
custom thresholds. For more information about threshold setting, see "
{
History Record—Click the History Record icon
for a monitor index to view the history graph
of the physical threads, logical threads, total connections, or thread queue length trend. Point to
a spot on the curve to view the data at the specific time point. Authorized users can view
statistics over the last 1 hour, last 6 hours, today, yesterday, this week, this month, and this year
by clicking the corresponding icons.
.NET Abnormality
The .NET Abnormality area layout is shown in
.