Yaskawa MP900 Series Machine Controller for Standard Operation User Manual
Page 294
4.5 Data Trace Definitions
4-37
4
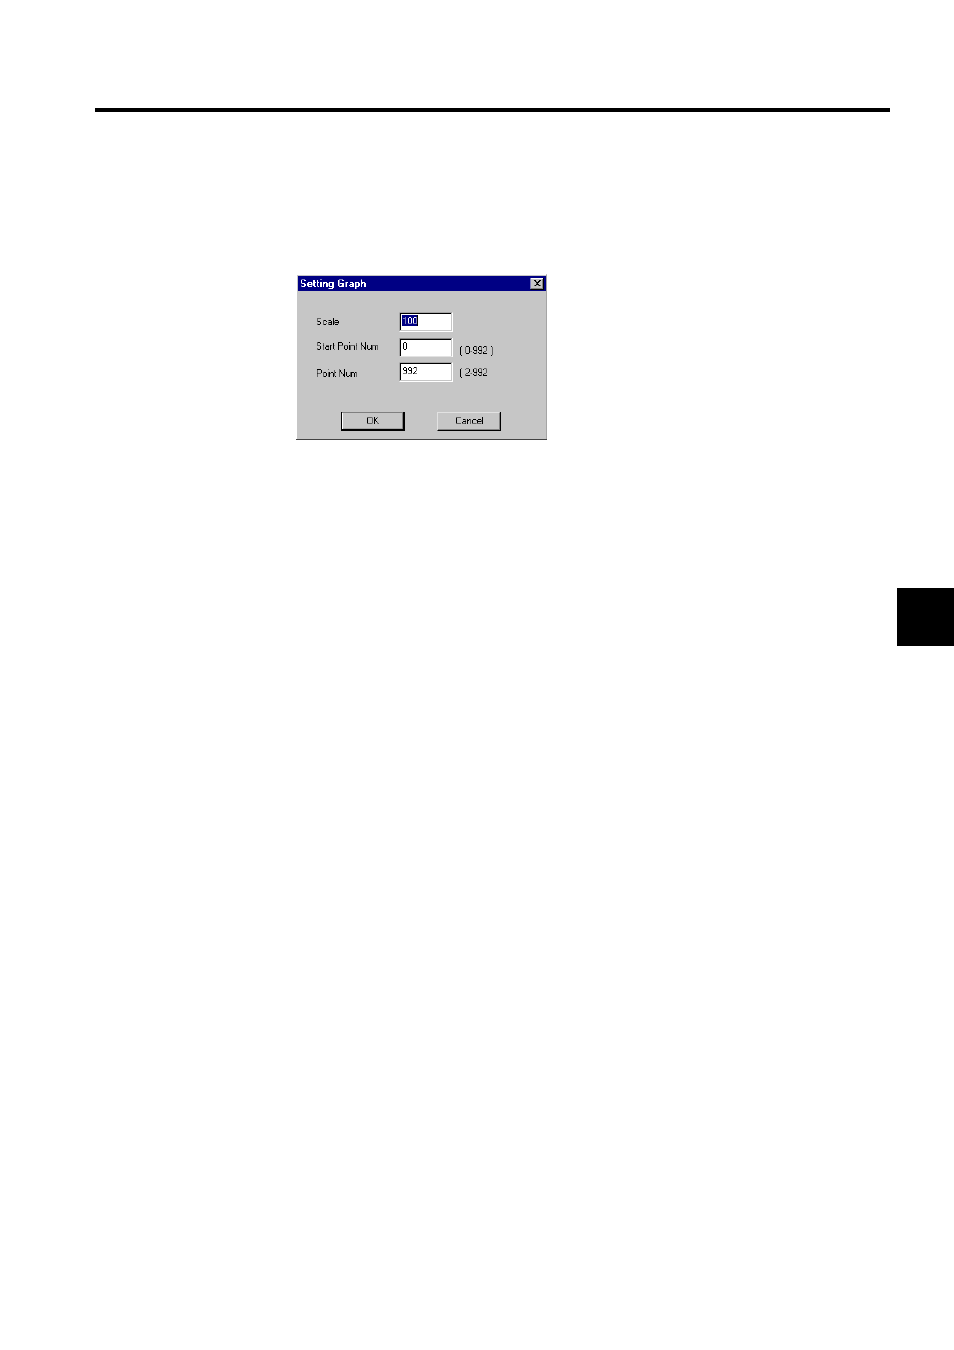
Setting Graph Button
1. Click the Setting Graph Button. The following Setting Graph Dialog Box will be dis-
played.
2. Input the graph settings in the dialog box, and then click the OK Button.
The graph display will be changed according to the new settings.
Updating Display Data
The most recent trace data can be displayed.
For details on how to update the trace data display, refer to Updating Display Data under
4.5.5 List Tab Page.
Manually Starting and Stopping Data Traces
Traces can be started and stopped manually.
For details on how to start and stop data traces manually, refer to Manually Starting and
Stopping Data Traces under 4.5.5 List Tab Page.
Changing the Trace Time Axis
The trace time axis can be changed.
For details on how to change the time axis for displaying the trace data, refer to Changing
the Trace Time Axis under 4.5.5 List Tab Page.
Changing the Beginning Sample Number for Display
The beginning sample number can be changed.
For details on how to display trace data beginning with any desired sample number, refer to
Changing the Beginning Sample Number for Display under 4.5.5 List Tab Page.
Changing the Amount of Data to be Read
The number of data items to be read can be changed.
For details on how to change the number of trace data to be read, refer to Changing the
Amount of Data to be Read under 4.5.5 List Tab Page.