The 46 curve, Table 194, Ng table 194 – Basler Electric BE1-11m User Manual
Page 474
462
9424200996 Rev L
Basler Electric protection systems have a maximum time dial setting of 9.9. The Basler Electric equivalent
time dial setting for the electromechanical maximum setting is provided in the cross-reference table even
if it exceeds 9.9. This allows interpolation as noted above.
Basler Electric time current characteristics are determined by a linear mathematical equation. The
induction disk of an electromechanical relay has a certain degree of non-linearity due to inertial and
friction effects. For this reason, even though every effort has been made to provide characteristic curves
with minimum deviation from the published electromechanical curves, slight deviations can exist between
them.
In applications where the time coordination between curves is extremely close, we recommend that you
choose the optimal time dial setting by inspection of the coordination study. In applications where
coordination is tight, it is recommended that you retrofit your circuits with Basler Electric electronic
protection systems to ensure high timing accuracy.
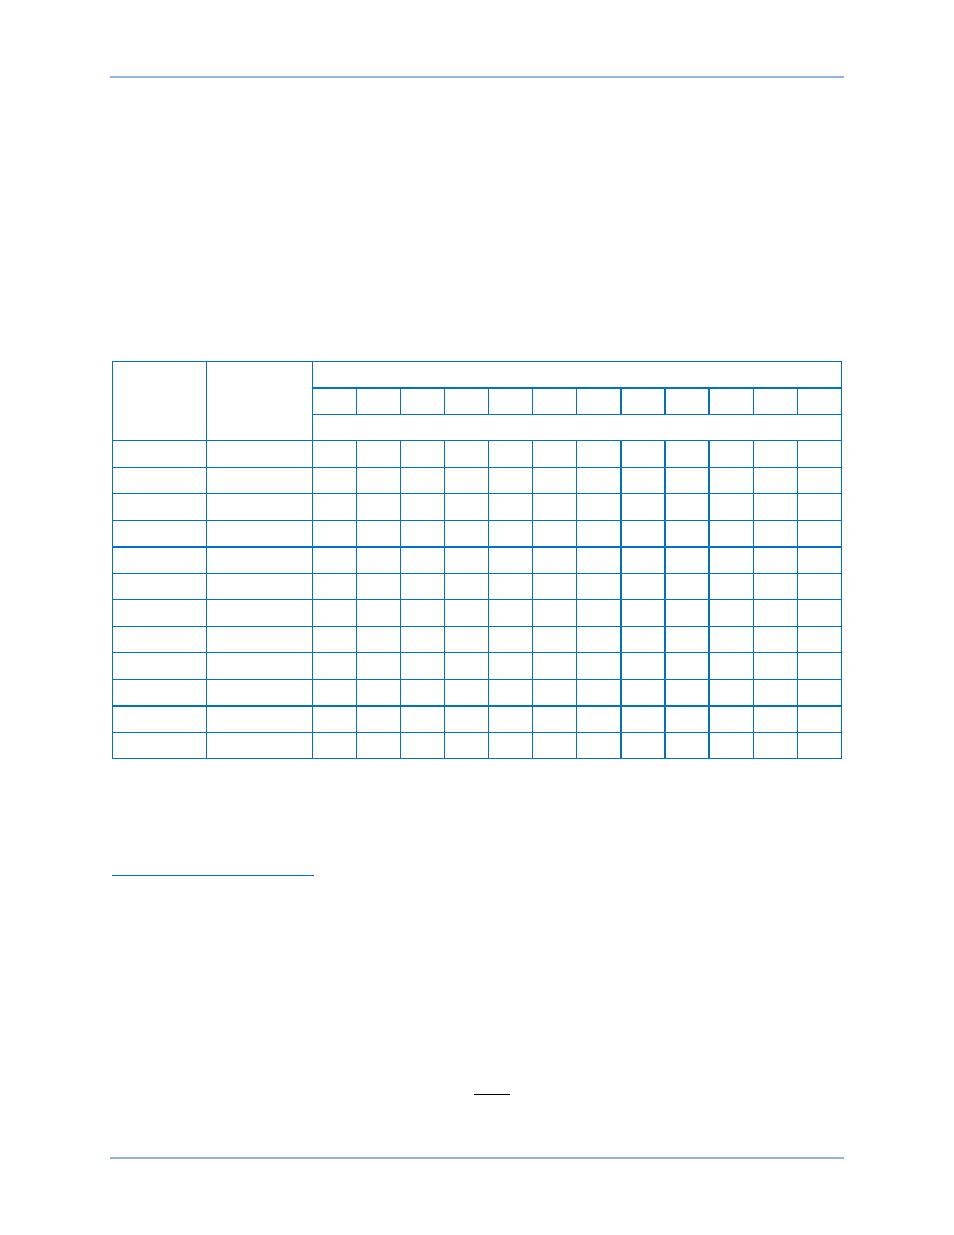
Table 194. Time Dial Setting Cross-Reference
Curve
Equivalent
To
Electromechanical Relay Time Dial Setting
0.5
1.0
2.0
3.0
4.0
5.0
6.0
7.0
8.0
9.0 10.0 11.0
Basler Electric Equivalent Time Dial Setting
S1
ABB CO-2
0.3
0.8
1.7
2.4
3.4
4.2
5.0
5.8
6.7
7.7
8.6
9.7
S2
GE IAC-55
0.2
1.0
2.0
3.1
4.0
4.9
6.1
7.2
8.1
8.9
9.8
n/a
I1
ABB CO-8
0.3
0.7
1.5
2.3
3.2
4.0
5.0
5.8
6.8
7.6
8.7
n/a
I2
GE IAC-51
0.6
1.0
1.9
2.7
3.7
4.8
5.7
6.8
8.0
9.3
n/a
n/a
M
ABB CO-7
0.4
0.8
1.7
2.5
3.3
4.3
5.3
6.1
7.0
8.0
9.0
9.8
L1
ABB CO-5
0.4
0.8
1.5
2.3
3.3
4.2
5.0
6.0
7.0
7.8
8.8
9.9
L2
GE IAC-66
0.4
0.9
1.8
2.7
3.9
4.9
6.3
7.2
8.5
9.7
n/a
n/a
V1
ABB CO-9
0.3
0.7
1.4
2.1
3.0
3.9
4.8
5.7
6.7
7.8
8.7
9.6
V2
GE IAC-53
0.4
0.8
1.6
2.4
3.4
4.3
5.1
6.3
7.2
8.4
9.6
n/a
E1
ABB CO-11
0.3
0.7
1.5
2.4
3.2
4.2
5.0
5.7
6.6
7.8
8.5
n/a
E2
GE IAC-77
0.5
1.0
1.9
2.7
3.5
4.3
5.2
6.2
7.4
8.2
9.9
n/a
D
ABB CO-6
0.5
1.1
2.0
2.9
3.7
4.5
5.0
5.9
7.2
8.0
8.9
n/a
The 46 Curve
The 46 curve (Figure 309) is a special curve designed to emulate the (I
2
)
2
t withstand ratings of generators
using what is frequently referred to as the generator K factor.
The 46 Curve Characteristics
46 Pickup Current
Generators have a maximum continuous rating for negative sequence current. This is typically expressed
as a percent of stator rating. When using the 46 curve, the user should convert the continuous I
2
rating
data to actual secondary current at the BE1-11m. This value (plus some margin, if appropriate) should be
entered as the pickup setting. For example, if a generator’s rated full-load current is 5 amperes, a pu
setting of 0.5 A would allow 10% continuous I
2
.
46 Time Dial (= Generator K factor)
The amount of time that a generator can withstand a given level of unbalance is defined by Equation 28.
𝑡 =
𝐾
(𝐼
2
)
2
Equation 28
Time Curve Characteristics
BE1-11m