Basler Electric BE1-11m User Manual
Page 504
Advertising
492
9424200996 Rev L
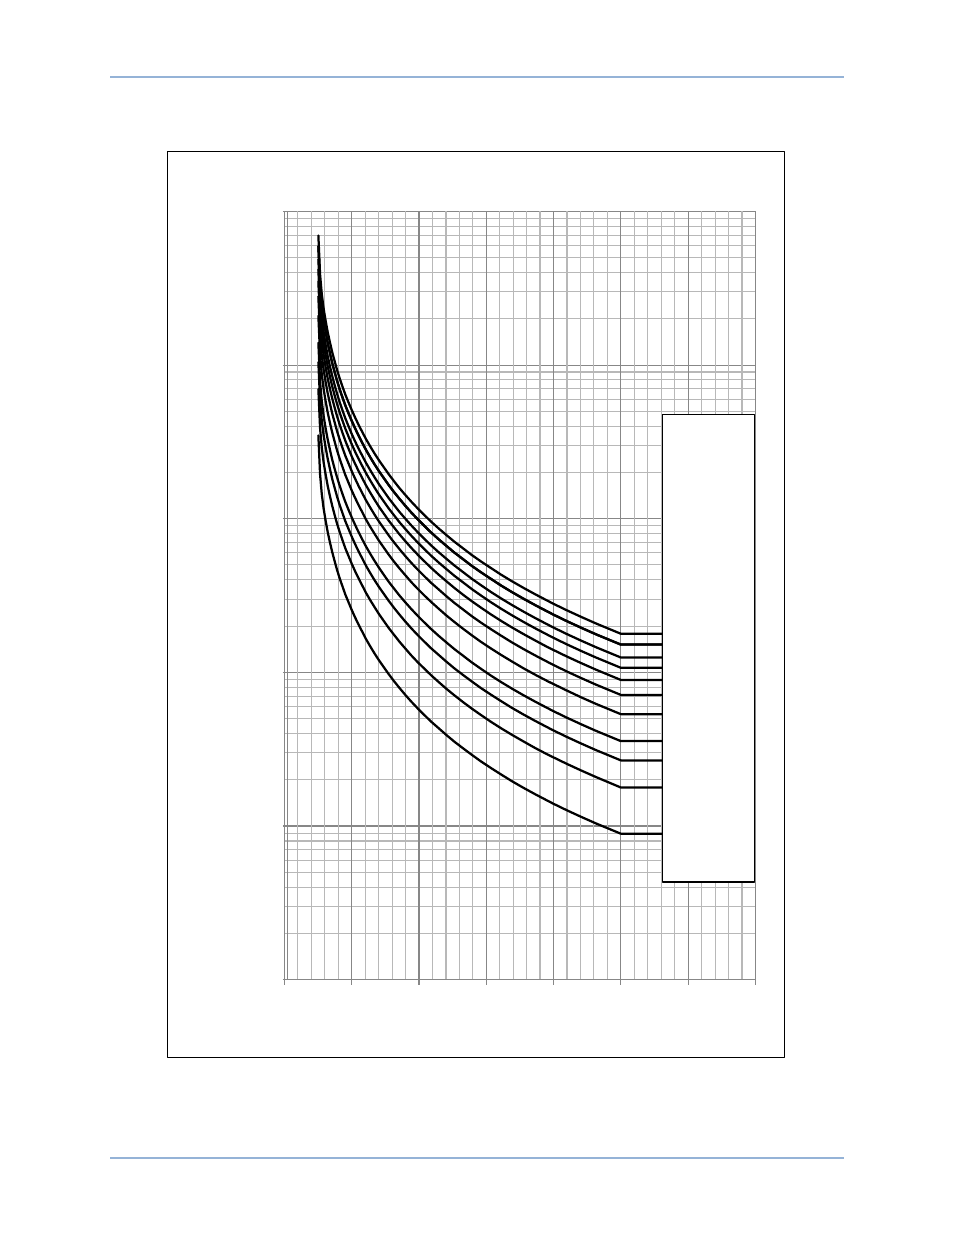
The standard curve is illustrated in Figure 312.
Figure 312. 49TC Standard Curve
0.1
1
10
100
1000
10000
0
2
4
6
8
10
12
14
TI
M
E
IN
S
EC
ON
DS
Multiple of Overload Pickup
T
I
M
E
D
I
A
L
20
17
14
12
4
10
8
6
3
2
1
Time Curve Characteristics
BE1-11m
Advertising
This manual is related to the following products: