Basler Electric BE1-11m User Manual
Page 552
Advertising
540
9424200996 Rev L
●
OPERATING PERFORMANCE
○
Load % ........................................................... 100 ...... 75 ........ 50
○
Efficiency % ................................................... 97.23 ... 97.22 ... 96.85
●
OTHER
○
Name
○
Location
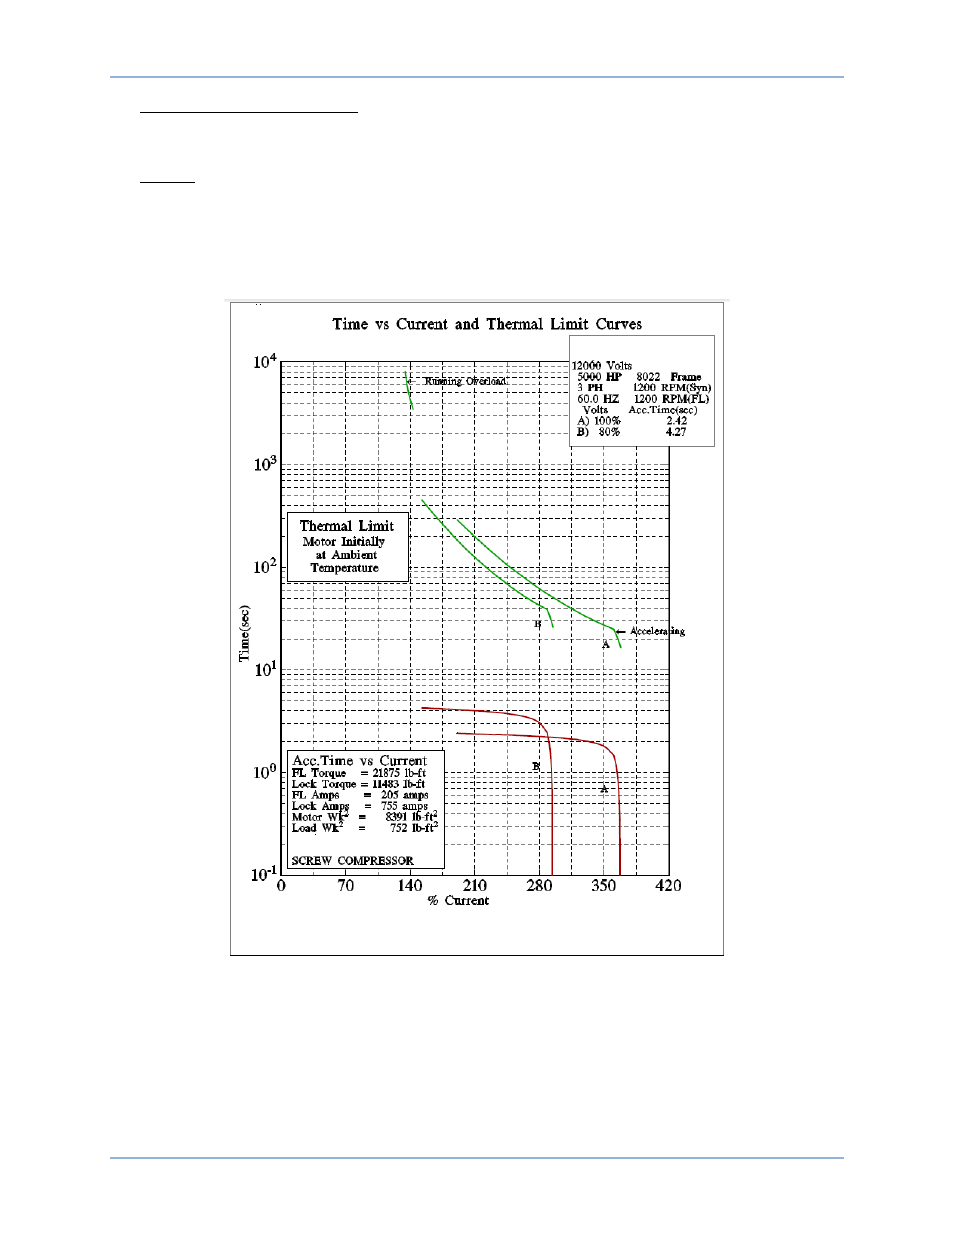
The required motor curves are shown in Figure 368. Curve A shows the thermal limits at 100 percent of
the starting voltage. Curve B shows the thermal limits at 85 percent of the starting voltage. Figure 369
shows the synchronous motor V curves indicating operational parameters of load an power factor.
Figure 368. Time vs. Current and Thermal Limit Curves
Settings Calculation Examples
BE1-11m
Advertising
This manual is related to the following products: