Yaskawa MotionSuite Series Machine Controller Software Manual User Manual
Page 236
MotionSuite™ Series Machine Controller Software Manual
Chapter 7: System Data Definition
7-63
the movement of the scroll box. When OFF, the graph does not scroll while the
scroll box is dragged, and the graph is re-displayed at completion of dragging.
15. Sample Number
This displays the sample number. The display format changes according to the
trace time axis. It is possible to display vertical lines in the graph display by
selecting the sample number position.
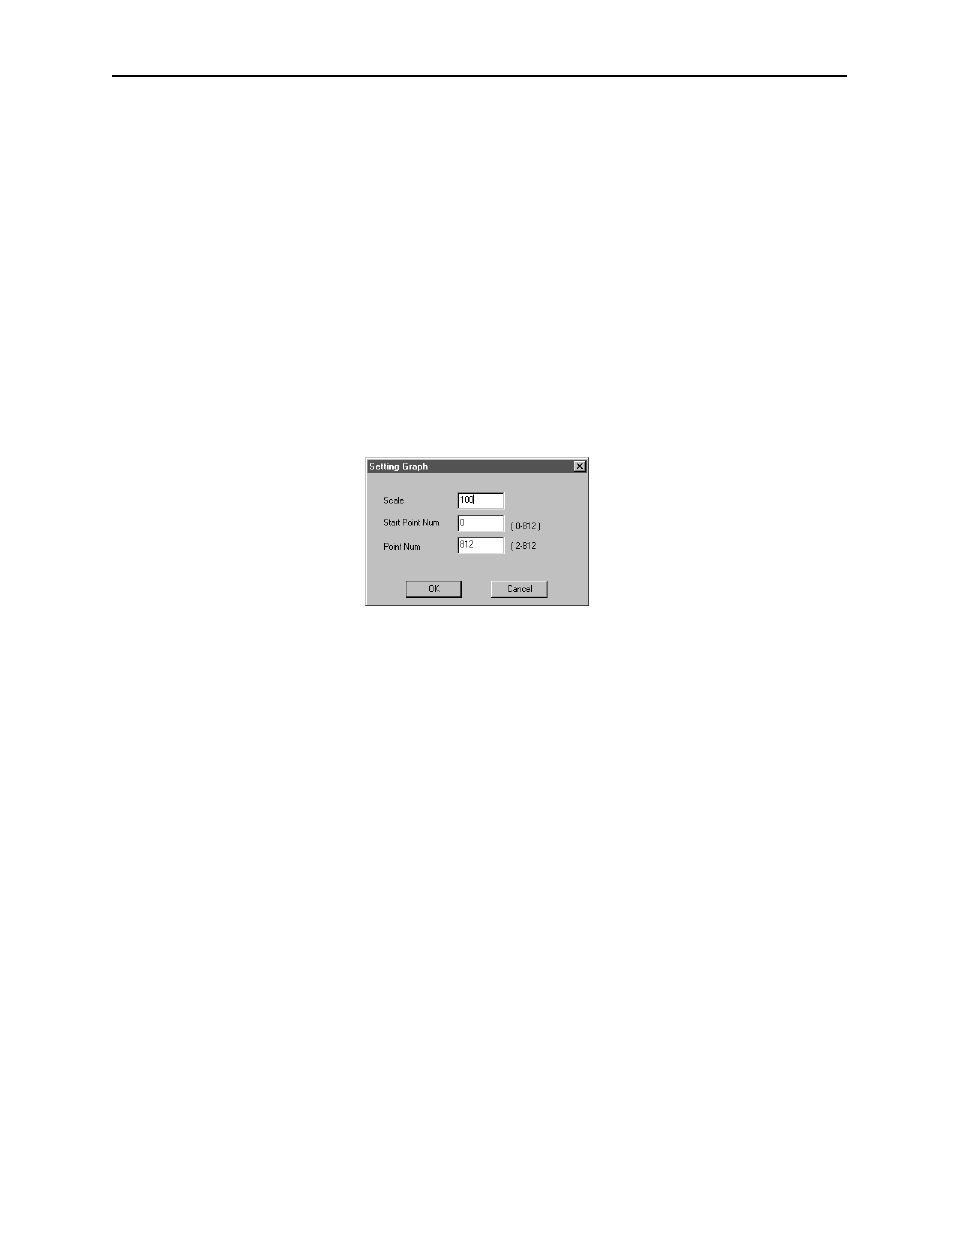
16. Setting Graph Pointer
It is possible to modify the scale and displayed decimals of the currently dis-
played graph. These changes are made as follows:
a. Select the Setting Graph button.
b. Input the graph setting data into the dialogue box, and select the OK but-
ton.
c. The graph is re-displayed with the contents set in (b).
Display Data Update
This function displays the newest trace data. See the subsection, “Display Data
Update” in item 7.7.8 for instructions to display the newest trace data.
Manual Stop/Start of Trace
This function manually stops/starts the trace data. See the subsection “Manual Stop/
Start of Trace” in item 7.7.8 for instructions to manually stop/start trace.
Trace Time Axis Change
This function changes the time axis displaying the trace data. See the subsection
“Trace Time Change” in item 7.7.8, for instructions to change the trace time box.
Display Start Sample Number Change
This function displays trace data from a desired sample number. See the subsection
“Changing Display Start Sample Number” in item 7.7.8, for instructions to change
sample numbers.