H3C Technologies H3C Intelligent Management Center User Manual
Page 107
93
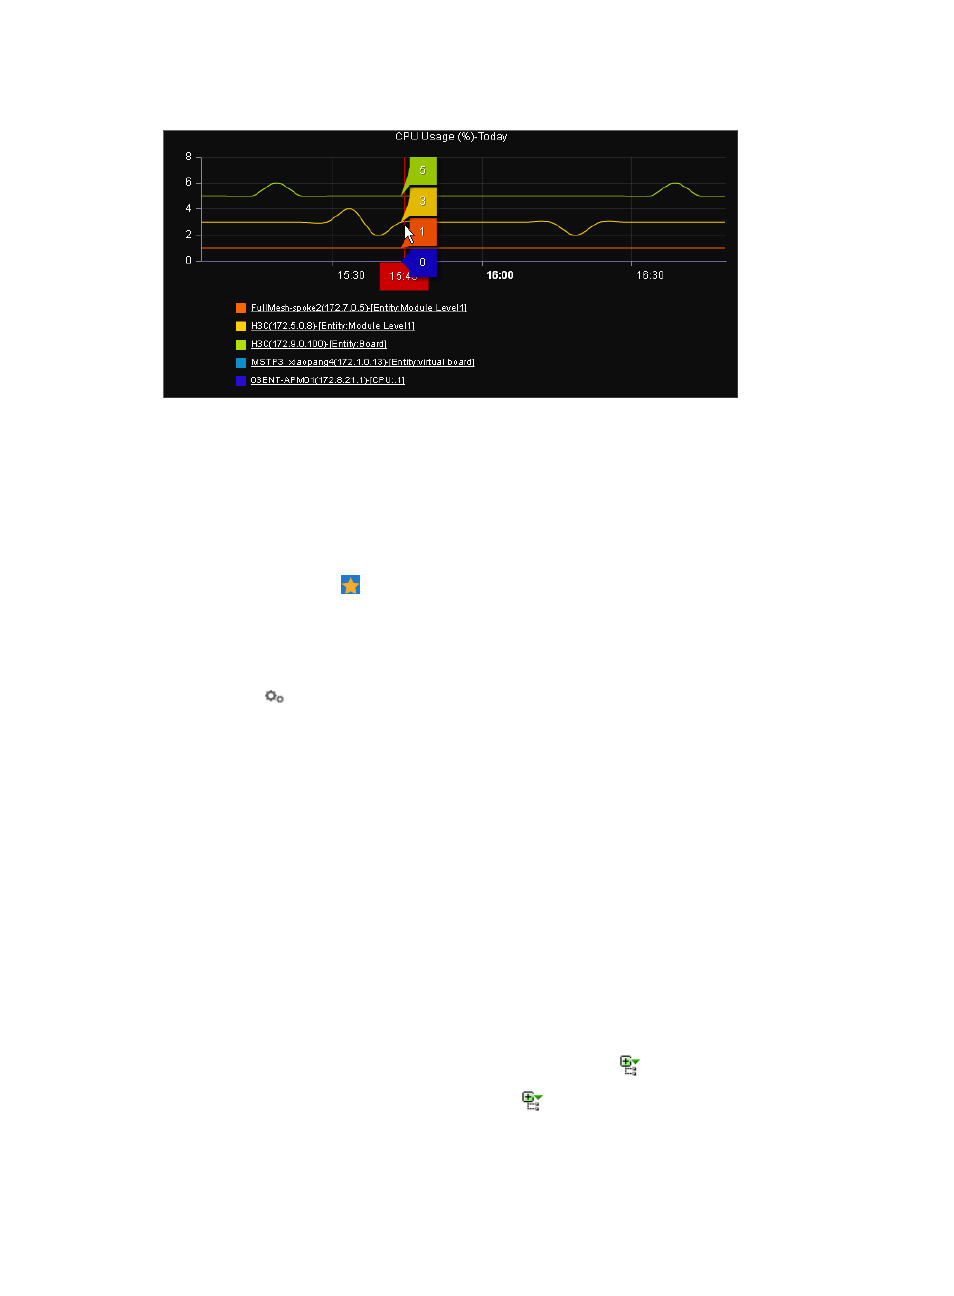
Figure 46 Performance Trend widget contents
When you place the pointer over a curve in the diagram, the performance data of the instance that the
curve represents automatically appears in a message balloon. To hide the message balloon, click the
instance name in the lower part of the diagram. When the instance name is no longer underlined, the
message balloon does not appear for the instance.
To configure the Performance Trend widget:
1.
Navigate to the view configuration window:
a.
Point to the icon located at the top of the left navigation tree.
A list of predefined and user-defined favorites appears.
b.
Point to the Display Tiling folder option.
The popup list appears.
c.
Click
Configuration in the popup list.
The view configuration window appears.
2.
Drag the Performance Trend widget from the widget area to the panel.
3.
Right-click the Performance Trend widget, and then select Parameter Configuration from the
shortcut menu.
The Parameter Configuration window appears.
4.
Select a time range for collecting the performance data. Options include Last Hour, Today,
Yesterday, This Week, Last Week, This Month, Last Month, This Year, and Last Year.
5.
Select one or more monitor instances:
a.
Click Add Instance.
The Select Instance window appears, displaying all monitor instances in the Performance
Management component.
b.
Select one or more instances:
Select an index from the Item Name list.
To expand all devices that contain a certain index, click
to the left of the index name.
To expand all instances on a device, click
to the left of the device name.
Select instances.
c.
Click OK.