H3C Technologies H3C Intelligent Management Center User Manual
Page 774
760
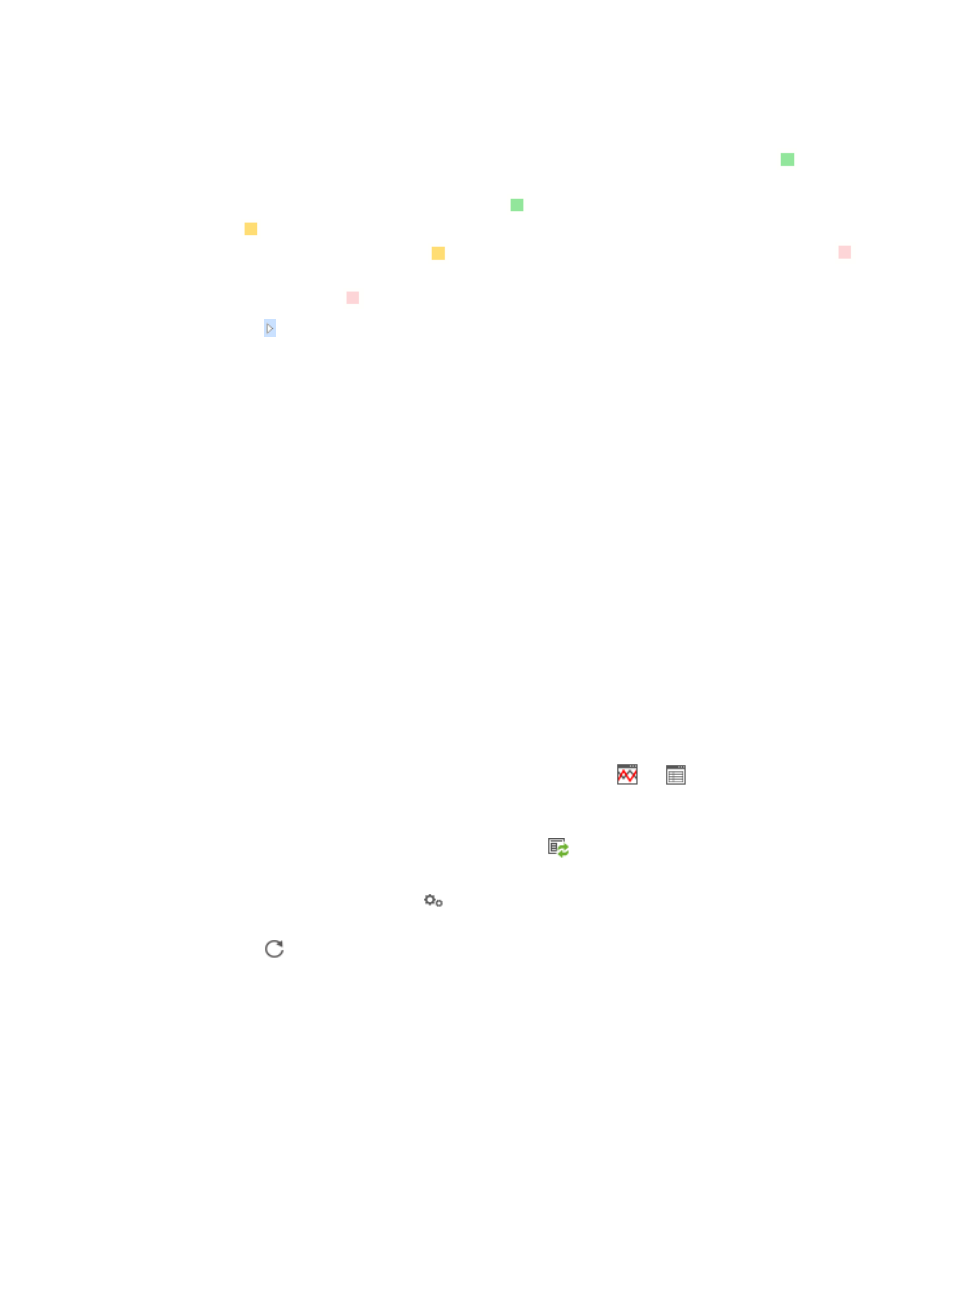
The popup window Monitoring Instances at a Glance appears.
Each colored box to the right of a device indicates the state of monitor instances, and the number
to the left of the box indicates the number of monitor instances in the associated state.
indicates
that the performance data is normal and might reach the first threshold or second threshold, but
triggers no alarms. The number to the left of
indicates the number of monitor instances in this
state.
indicates that the performance data has triggered the first threshold level and triggered
alarms. The number to the left of
indicates the number of monitor instances in this state.
indicates that the performance data has reached the second threshold and triggered alarms. The
number to the left of
indicates the number of monitor instances in this state.
4.
Click the link to the left of a device name to display all monitor indexes and monitor instances.
All the monitor instances of a monitor index are displayed in the form of bar box to the right of the
monitor index. The color of the bar box indicates the alarm status of the monitor instances.
5.
Click the name link of a monitor instance to enter the Performance Data window.
The Performance Data window displays the trend of performance data within a specified time in
the form of trend chart and the performance data collected within a specified interval in the form
of table.
6.
Select a time range for the performance data by using one of the following methods:
Select Last Hour, Today, Yesterday, This Week, Last Week, This Month, Last Month, This Year, or
Last Year on top of the Performance Data window to view the performance data within the
specified time.
Select Custom on top of the Performance Data window to view the performance data within a
customized time.
If you select Custom, click the field to the right of From to define the begin date and click the field
to the right of To to define the end date in the form of YYYY:MM:DD hh:mm, and then click Query
to view the performance data within a customized time.
7.
Close the Performance Data window to return to the Monitoring Instances at a Glance window.
8.
Query the performance data:
{
For a Trend Line or Data Grid performance view, click the
or
link on top of the window
to enter the Monitoring Data Statistics window. For more information, see "
Line or Data Grid performance view
{
For an At a Glance performance view, click the
icon to enter the Monitoring Data Statistics
window. For more information, see "
Viewing the At a Glance performance view
9.
Click the Modify Threshold icon
to modify thresholds in the popup window. For more
information, see "
Modify threshold settings on a performance view
."
10.
Click the
link on top of the window to refresh the current window.
Viewing the Trend Line or Data Grid performance view
1.
Navigate to Resource > Performance View:
a.
Click the Resource tab from the tabular navigation system on the top.
b.
Click the Performance Management link on the navigation tree on the left.
c.
Click Performance View under Performance Management from the navigation system on the
left.
The Performance View page displays with the Performance View List populated.
2.
Navigate to the folder that contains the performance view you want to view.