Device unreachability (%) – topn, Bandwidth utilization (in) (%) – topn – H3C Technologies H3C Intelligent Management Center User Manual
Page 62
48
Click the Set icon
on the top right corner of the widget and select Setting to launch the Setting dialog
box:
•
Time Range—Specifies the time range for statistics collection. The available options include Last
Hour, Today, Yesterday, This Week, Last Week, This Month, Last Month, This Year, and Last Year.
•
Top—Specifies the number of devices for the widget. The available options include 5, 10, 20, and
30.
By default, Device Response Time (ms) – TopN widget is displayed on the Welcome space of the IMC
home page.
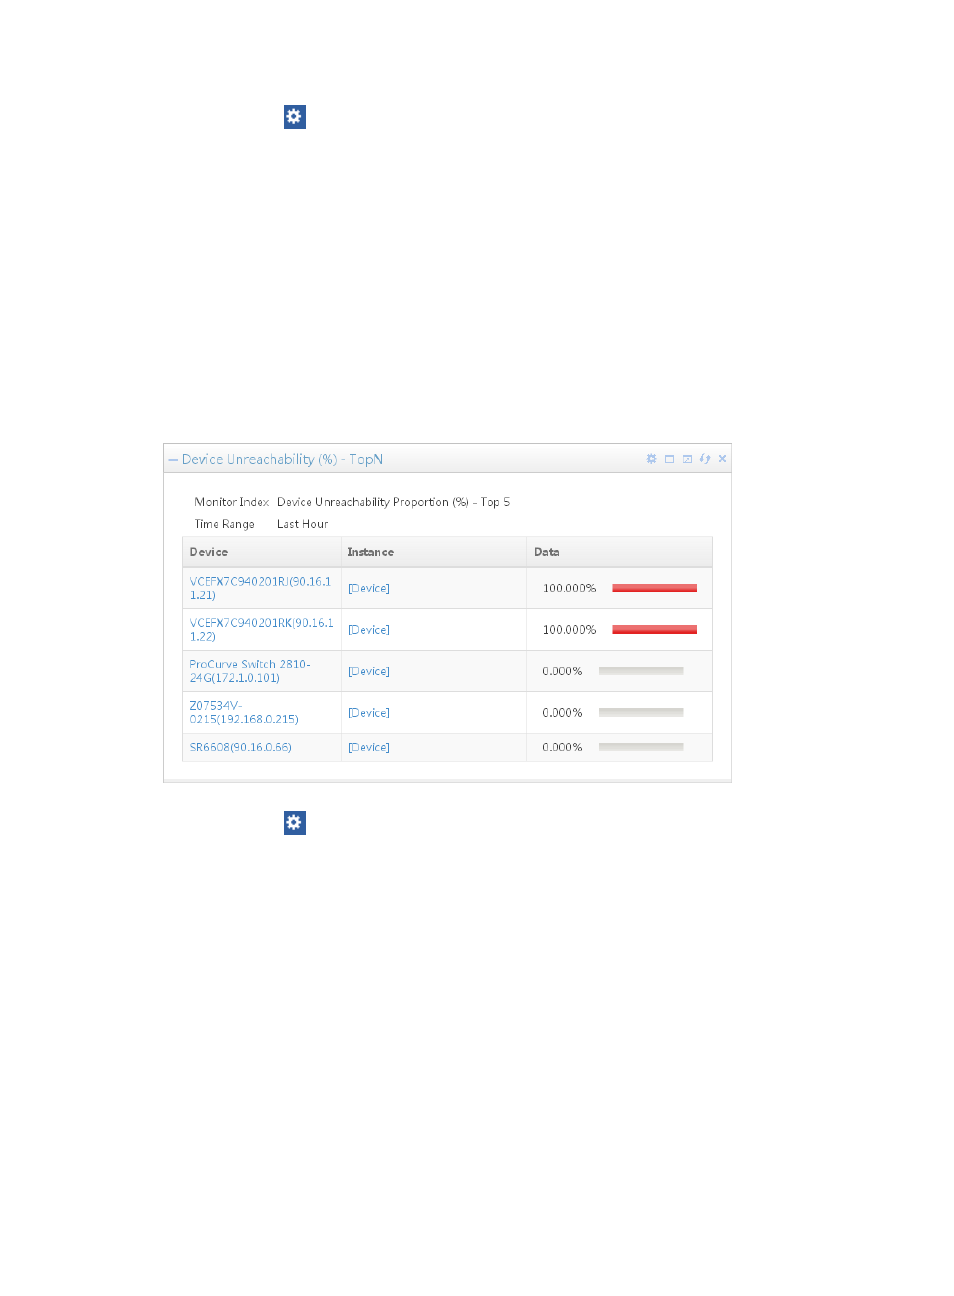
Device unreachability (%) – TopN
By default, the device unreachability table, shown in
, displays the top 5 devices with the
highest unreachability rate within the last hour. The content includes the time range, device name and IP,
and the unreachability rate.
Figure 12 Device unreachability
Click the Set icon
on the top right corner of the widget and select Setting to launch the Setting dialog
box:
•
Time Range—Specifies the time range for statistics collection. The available options include Last
Hour, Today, Yesterday, This Week, Last Week, This Month, Last Month, This Year, and Last Year.
•
Top—Specifies the number of devices for the widget. The available options include 5, 10, 20, and
30.
By default, Device Unreachability (%) – TopN widget is displayed on the Welcome space of the IMC
home page.
Bandwidth utilization (In) (%) – TopN
By default, the Bandwidth Utilization (In) table, shown in
, displays the top 5 devices with the
highest inbound traffic bandwidth utilization within the last hour. The content includes the time range,
device name, IP, and the Interface In-Bandwidth Usage.