Cpu utilization (%) – topn, Port group topn – H3C Technologies H3C Intelligent Management Center User Manual
Page 59
45
After you customize the performance instance profiles for the first time, you can click Performance
Instance Profile to add a performance instance profile, for more information, see "
." Or select a created performance instance profile with the Setting function.
To select a performance instance profile that has been created, click the Set icon
on the top right
corner of the widget and select Setting to launch the Setting dialog box:
•
Name—Specifies the name of a performance instance profile. All existing performance instance
profiles are displayed in the list.
•
Time Range—Specifies the time range for statistics collection.
•
Type—Specifies how the Performance Instance Profile is displayed, including Trend Line and Data
Grid. A trend line displays the performance data trend for each monitor instance within the past
period. A data grid displays the performance data statistics for each monitor instance within the
past period, including the maximum, minimum, and average value of performance data.
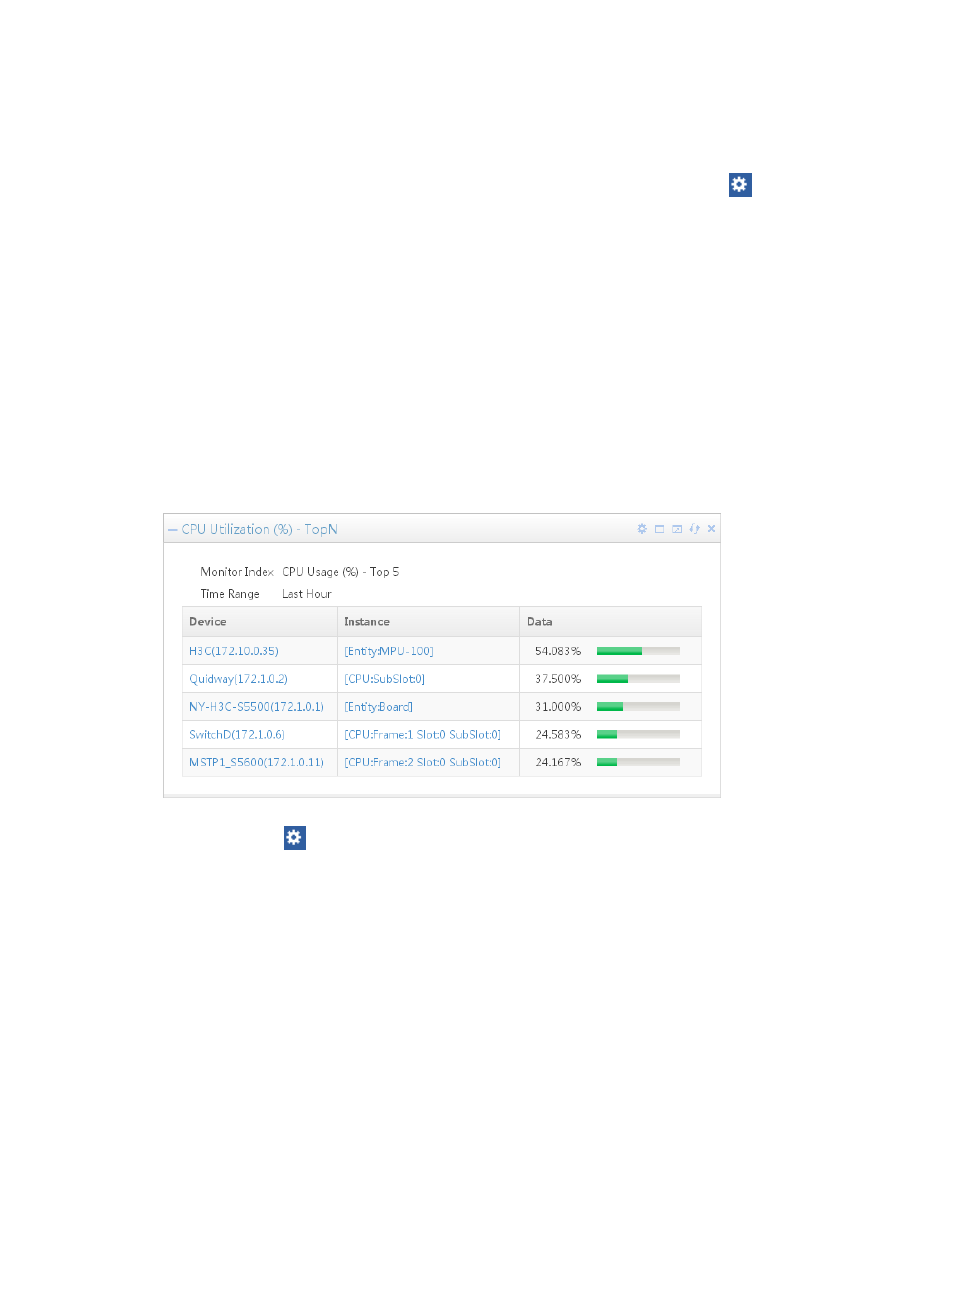
CPU utilization (%) – TopN
By default, the CPU utilization table, shown in
, displays the top 5 high-utilization CPUs within the
last hour. The content includes the time range, device/slot that the CPU belongs, and the CPU utilization.
Figure 8 CPU utilization
Click the Set icon
on the top right corner of the widget and select Setting to launch the Setting dialog
box:
•
Time Range—Specifies the time range for statistics collection. The available options include Last
Hour, Today, Yesterday, This Week, Last Week, This Month, Last Month, This Year, and Last Year.
•
Top—Specifies the number of monitoring instances for the widget. The available options include 5,
10, 20, and 30.
By default, CPU Utilization (%) - TopN widget is displayed on the Welcome space of the IMC home page.
Port Group TopN
The Top Group TopN widget, as shown in
, displays topN performance monitoring data of
interfaces and their device names in the specified port group.