Memory utilization (%) – topn, Figure 9 – H3C Technologies H3C Intelligent Management Center User Manual
Page 60
46
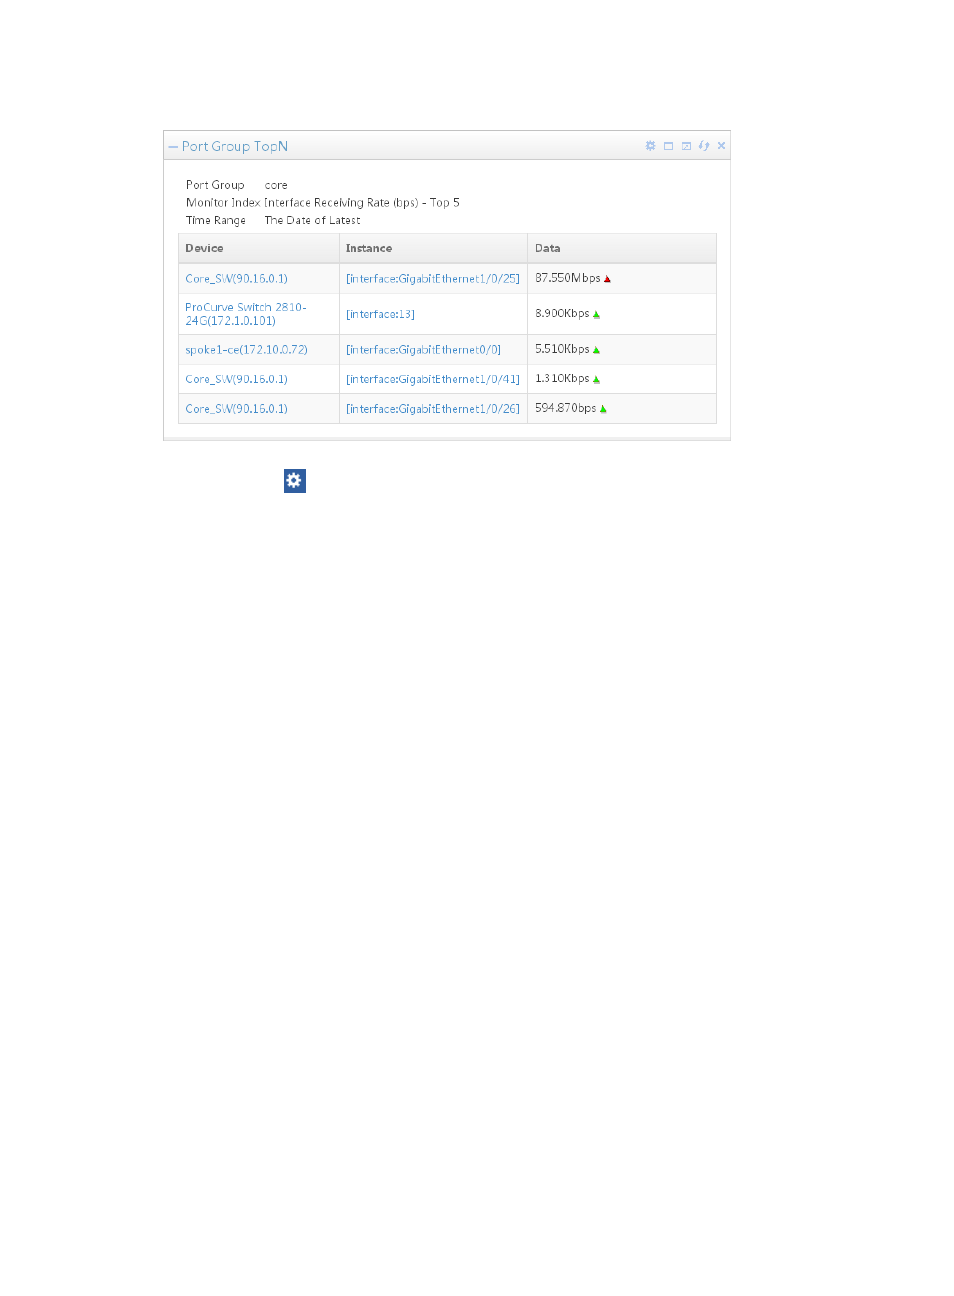
Figure 9 Port Group TopN
Click the Set icon
on the top right corner of the widget and select Setting to launch the Setting dialog
box:
•
Port Group—Select a port group from the list. Options include all existing port groups in IMC.
•
Monitor Index—Select a performance index from the list. Options include Interface Receiving Rate
(bps), Interface Transmitting Rate (bps), Interface In-Bandwidth Usage (%), Interface
Out-Bandwidth Usage (%), Interface Receiving Broadcasting Rate (packet/s), Interface
Transmitting Broadcasting Rate (packet/s), Proportion of Receiving Packets Discarded on Interface
(%), and Proportion of Transmitting Packets Discarded on Interface (%).
•
Top—Specifies the number of monitoring instances for the widget. The available options include 5,
10, 20, and 30.
Memory utilization (%) – TopN
By default, the memory utilization table, shown in
, displays the top 5 high-utilization memories
within the last hour. The content includes the time range, device/slot that the memory belongs, and the
memory utilization.