Performance monitor (table) widget – H3C Technologies H3C Intelligent Management Center User Manual
Page 109
95
b.
Point to the Display Tiling folder option.
The popup list appears.
c.
Click
Configuration in the popup list.
The view configuration window appears.
2.
Drag the Custom Topology widget from the widget area to the panel.
3.
Right-click the Custom Topology widget, and then select Configure Parameters from the shortcut
menu.
The Configure Topology window appears.
4.
Select the Use the background color of the topology configuration option to use the color of the
topology configuration as the background color. If this option is not selected, the background
color is determined by the screen tiling configuration.
5.
Set the refresh interval for the custom topology.
6.
Select a custom topology from the Custom Topology list.
7.
Click OK.
8.
Click Save Configuration .
Performance Monitor (Table) widget
Figure 49 Widget icon
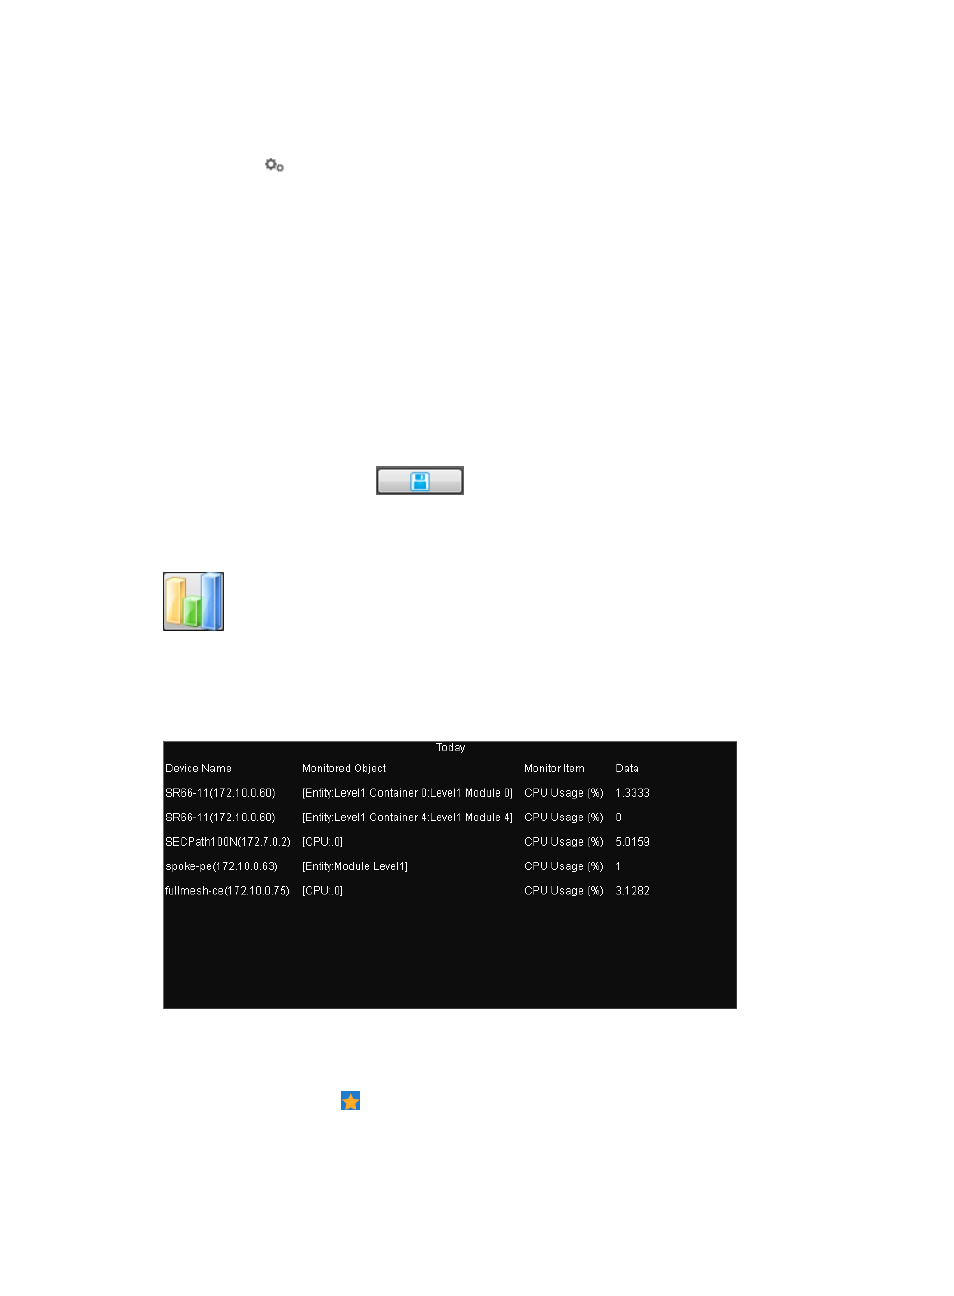
The Performance Monitoring (Table) widget displays history monitoring data in a table. Operators must
set the time range for performance data collection and select the monitor instances.
Figure 50 Performance Monitor (Table) widget
To configure the Performance Monitor (Table) widget:
1.
Navigate to the view configuration window:
a.
Point to the icon located at the top of the left navigation tree.
A list of predefined and user-defined favorites appears.
b.
Point to the Display Tiling folder option.